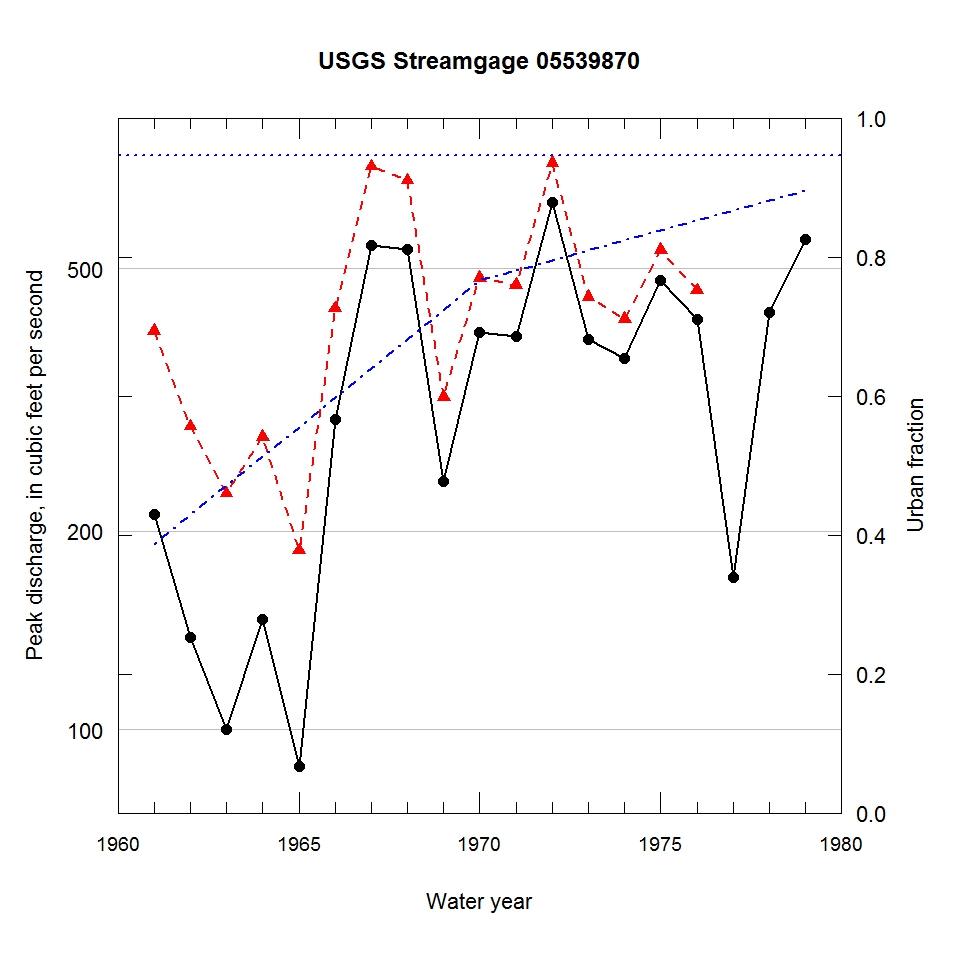
Observed and urbanization-adjusted annual maximum peak discharge and associated urban fraction and precipitation values at USGS streamgage:
05539870 WEST BRANCH DU PAGE RIVER AT ONTARIOVILLE, IL


| Water year | Segment | Discharge code | Cumulative reservoir storage (acre-feet) | Urban fraction | Precipitation (inches) | Observed peak discharge (ft3/s) | Adjusted peak discharge (ft3/s) | Exceedance probability |
| 1961 | 1 | -- | 0 | 0.387 | 0.945 | 212 | 402 | 0.563 |
| 1962 | 1 | -- | 0 | 0.429 | 0.197 | 138 | 288 | 0.843 |
| 1963 | 1 | -- | 0 | 0.471 | 0.874 | 100 | 228 | 0.941 |
| 1964 | 1 | -- | 0 | 0.513 | 1.269 | 147 | 278 | 0.867 |
| 1965 | 1 | -- | 0 | 0.555 | 0.094 | 88 | 187 | 0.969 |
| 1966 | 1 | -- | 0 | 0.598 | 0.931 | 295 | 435 | 0.487 |
| 1967 | 1 | -- | 0 | 0.640 | 0.866 | 542 | 714 | 0.100 |
| 1968 | 1 | -- | 0 | 0.682 | 1.127 | 535 | 680 | 0.124 |
| 1969 | 1 | -- | 0 | 0.724 | 0.973 | 238 | 319 | 0.775 |
| 1970 | 1 | -- | 0 | 0.766 | 1.073 | 400 | 484 | 0.375 |
| 1971 | 1 | -- | 0 | 0.780 | 0.265 | 395 | 472 | 0.405 |
| 1972 | 1 | -- | 0 | 0.795 | 0.977 | 630 | 722 | 0.097 |
| 1973 | 1 | -- | 0 | 0.809 | 0.557 | 390 | 453 | 0.447 |
| 1974 | 1 | -- | 0 | 0.823 | 0.447 | 365 | 419 | 0.524 |
| 1975 | 1 | -- | 0 | 0.838 | 0.599 | 480 | 533 | 0.264 |
| 1976 | 1 | -- | 0 | 0.852 | 0.830 | 418 | 463 | 0.425 |
| 1977 | 0 | -- | 230 | 0.867 | 0.448 | 170 | -- | -- |
| 1978 | 0 | -- | 230 | 0.881 | 0.995 | 429 | -- | -- |
| 1979 | 0 | -- | 230 | 0.895 | 0.589 | 553 | -- | -- |

